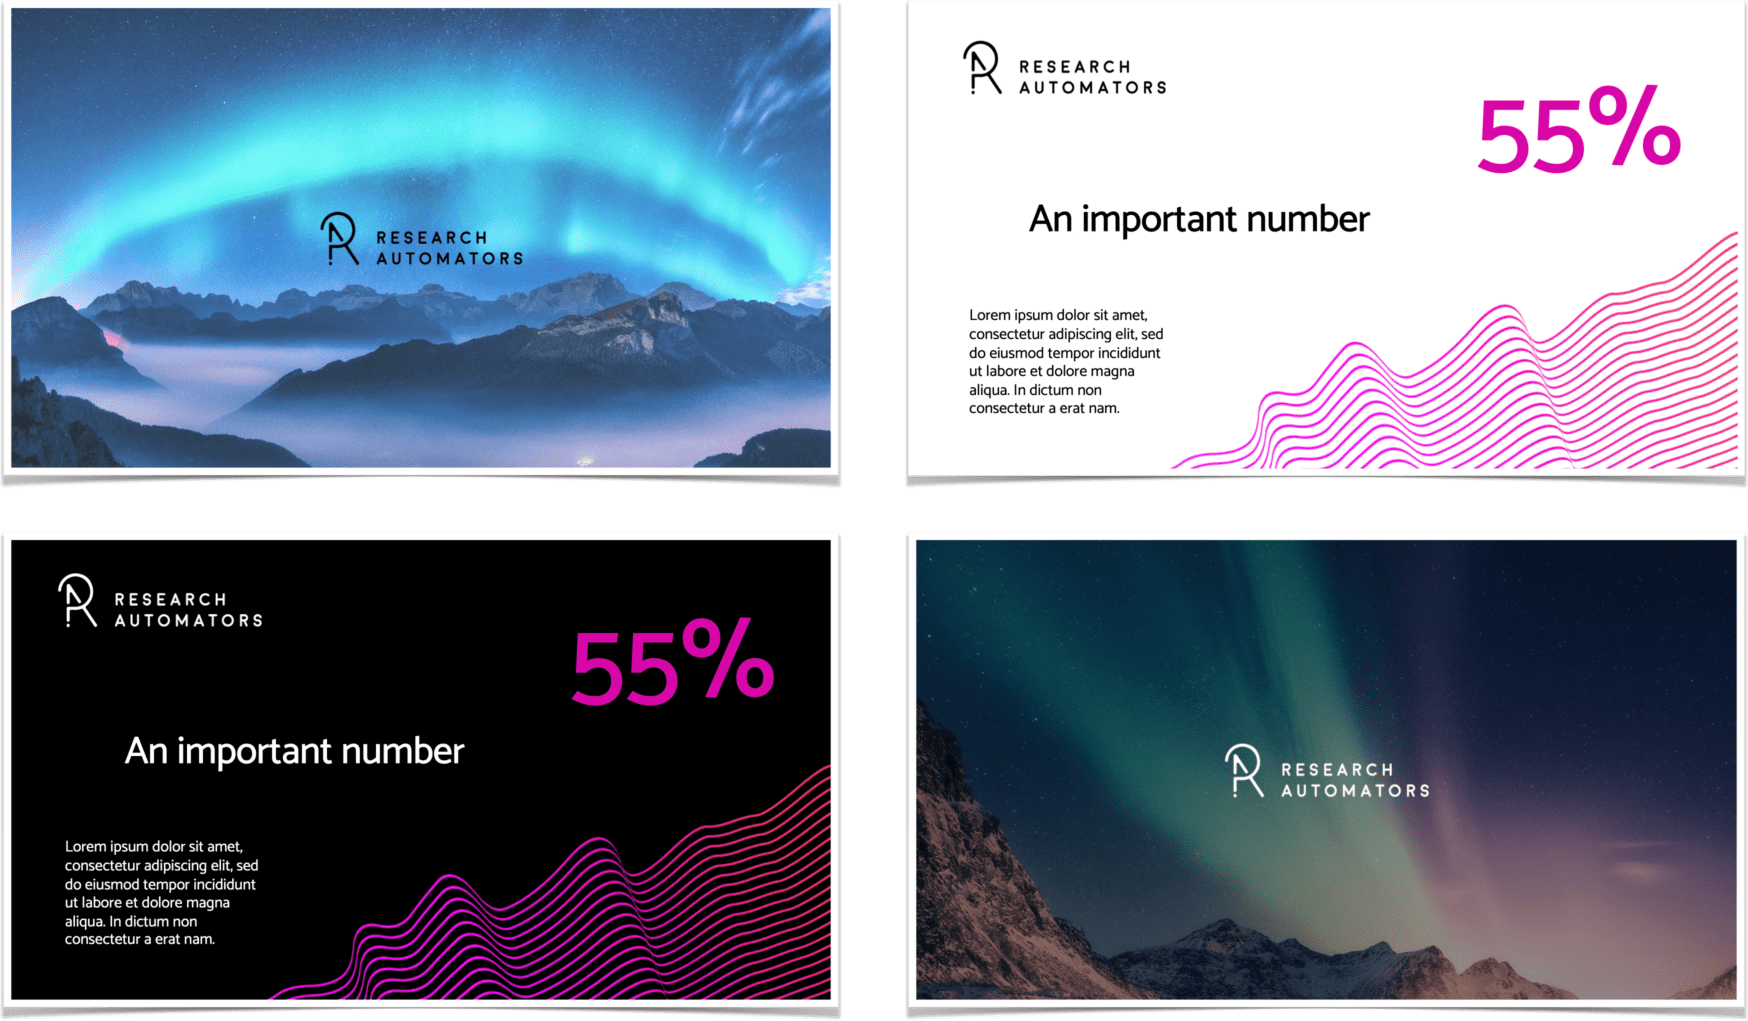
If you regularly work with survey data, learning how to automate survey reports can save you hours every week. Instead of manually copying charts into PowerPoint or formatting tables in Excel, automation gives you ready-to-use reports in minutes — with consistent design and accurate data.
With the right setup, you can move from raw responses to polished, shareable insights without repetitive manual work.
Why Automating Survey Reports Matters
Manual reporting isn’t just slow, it can be prone to errors. Numbers can be mistyped, slides can get out of sync, and charts might use outdated data.
When you automate survey reports, you:
● Save hours of manual work for every project
● Ensure charts and tables always use the latest data
● Keep branding consistent across all exports
● Reduce the risk of human error in reporting
Whether you run quarterly surveys, customer satisfaction studies, or employee engagement tracking, automation makes your workflow smoother and faster.
How Survey Automator Handles Report Automation
Survey Automator lets you export both Excel and PowerPoint reports directly from your dashboard — already formatted, filtered, and ready to share.
Here’s how it works:
● Apply Filters and Breakdowns
Select the data you want to include, such as a specific date range, customer segment, or language version.
● Choose Your Export Format:
● PowerPoint: Ready-made slides with your charts and insights in place
● Excel: Data tables for deeper analysis or integration with other tools
● Pick a Template
Upload a custom PowerPoint design or stick to the default. Templates keep fonts, colors, and layouts consistent.
● Click Export
Your automated survey report is generated instantly, following all your settings and filters.
Tips for Better Automated Reports
To get the most out of survey report automation, follow these best practices:
● Create branded templates
Build a PowerPoint master template with placeholders for charts and text. This ensures every export is on-brand without extra formatting.
● Segment smartly
Use breakdowns (like region or department) so each audience gets relevant data.
● Use multiple language exports
If your survey is multilingual, export in each language to avoid confusion.
Save recurring setups
For quarterly or monthly reports, keep the same filters so you can re-run reports in seconds.
From Data to Presentation in Minutes
Automating your Excel and PowerPoint reports turns a slow, manual process into a fast, reliable workflow. Instead of spending time formatting, you can focus on interpreting results and making decisions.
Ready to see the difference a professional template can make?
👉 See our ready-made PowerPoint report templates here and get inspired for your next project.
View templates →
