Advanced statistical calculations
We enable quick insights from the customer survey by visualising connections and colour coding significant differences.
AI Analysis - Let AI write texts about your tables & charts or create interesting headlines & insights.
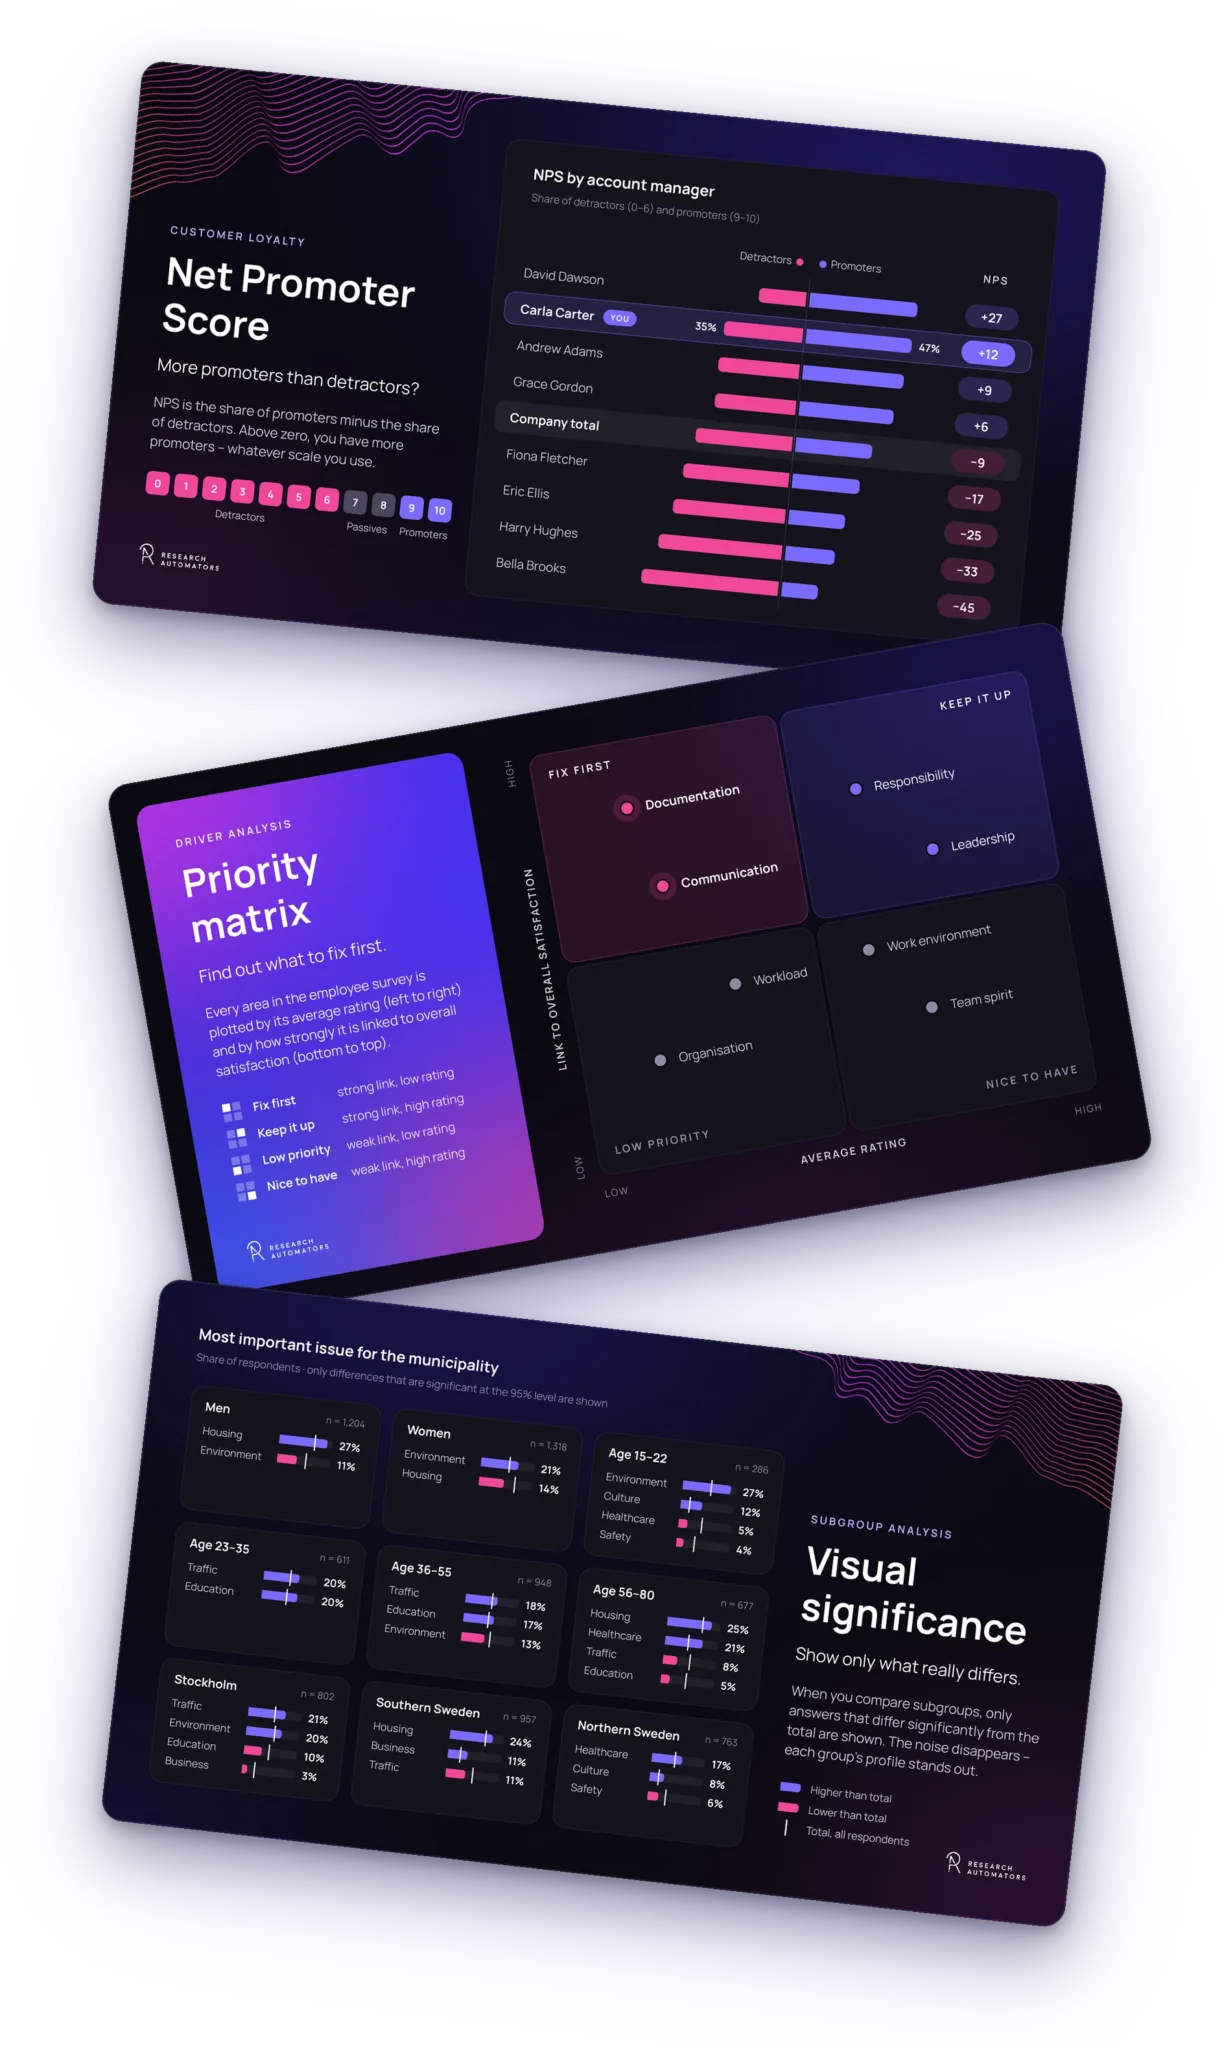
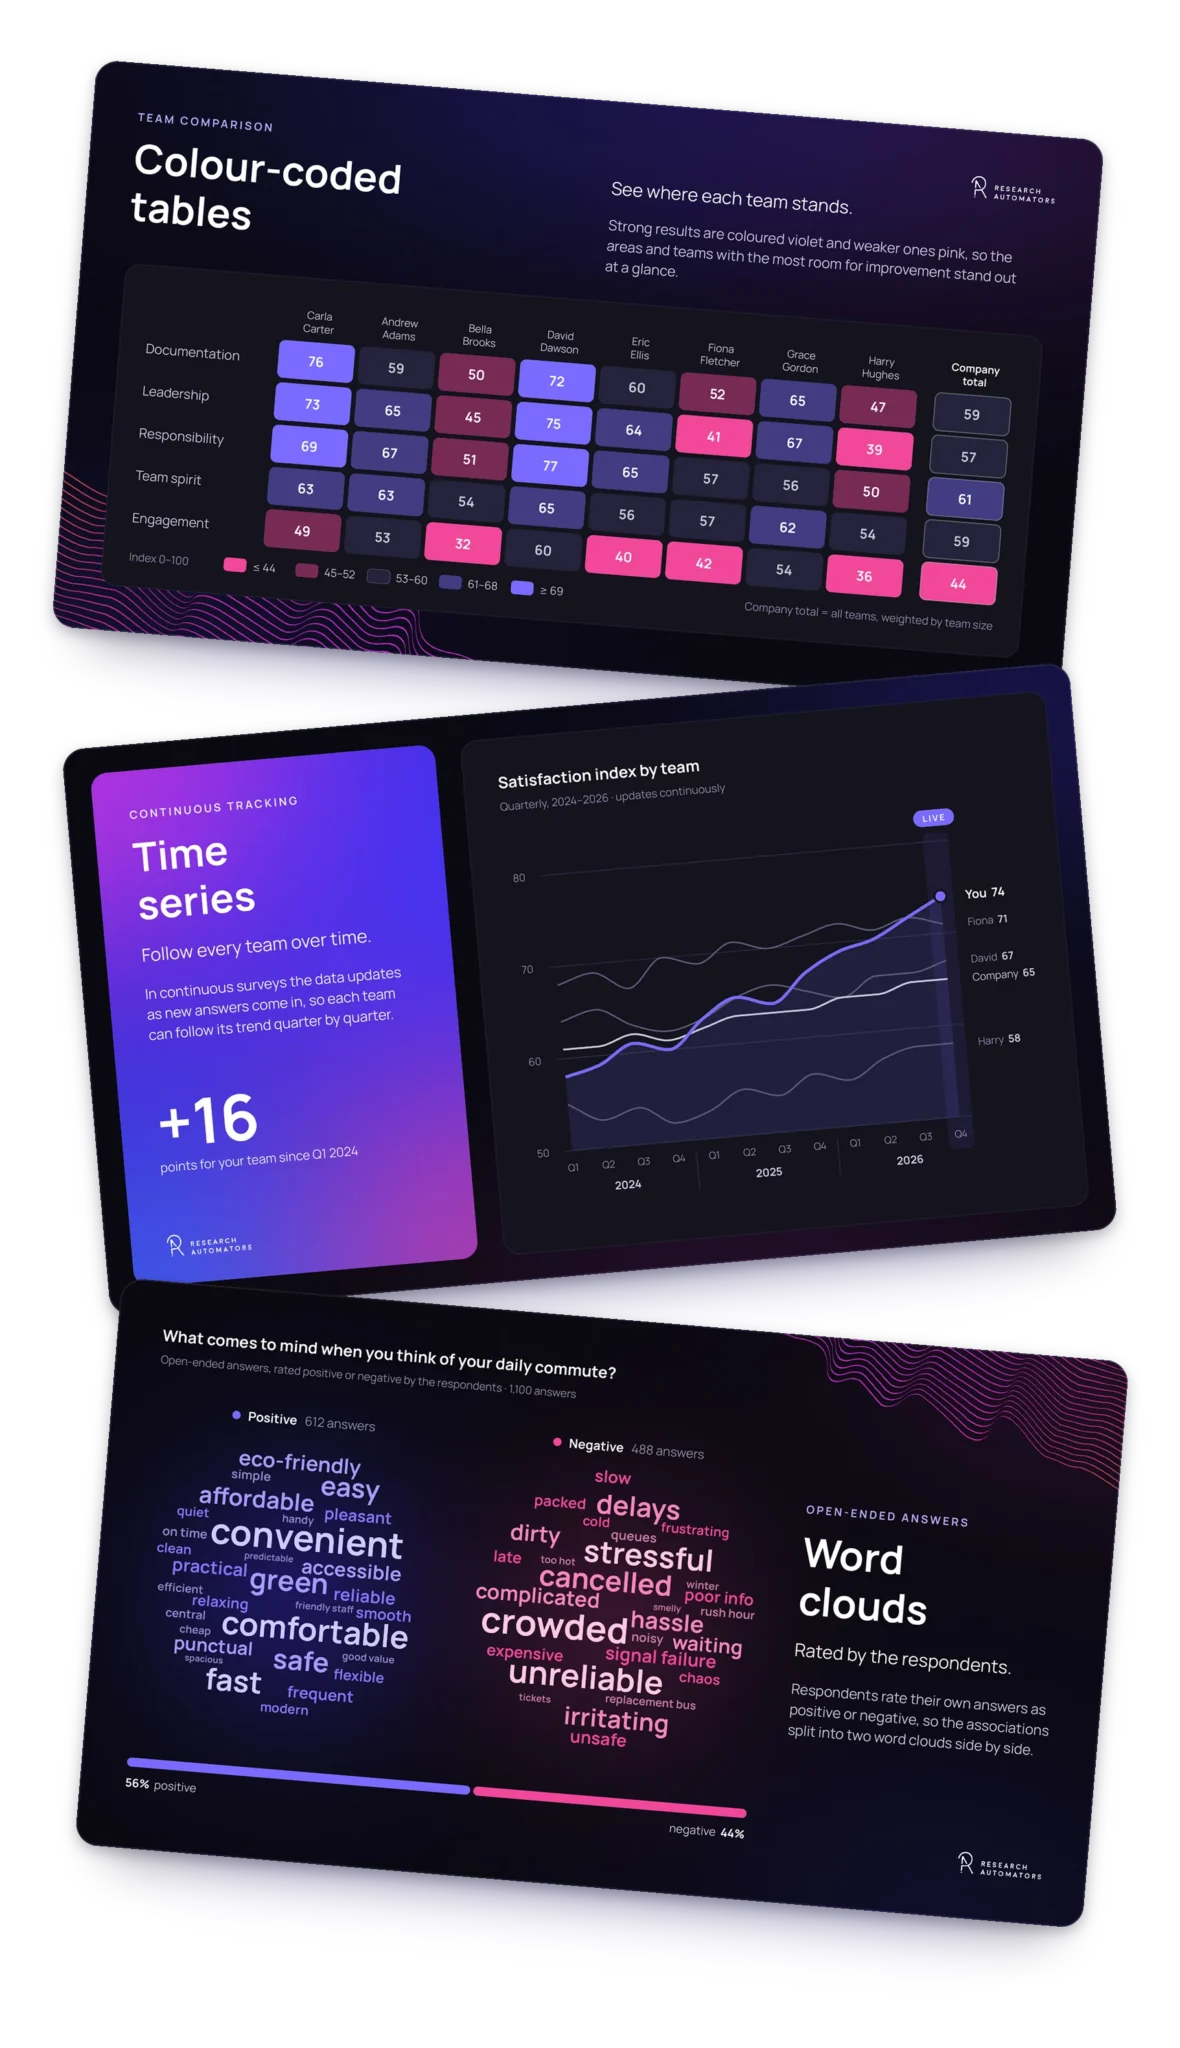
Significance – Emphasise significant differences with colours in both tables and graphs
Correlation – Visualise correlations with the overall satisfaction in priority matrices
Indexes / dimensions – Correlate several questions to provide one value, e.g., NKI
NPS – Visualise the difference between negative and positive responses
Time series – Continuous weighting, moving averages and dynamic period variables