AI-descriptions-Report
SURVEY REPORT WITH

AI descriptions

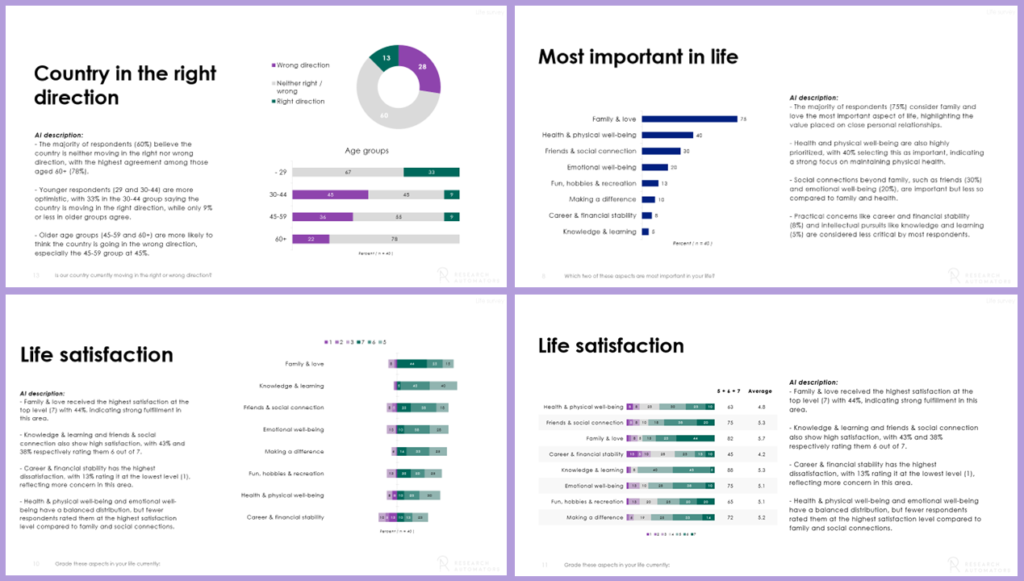
A PowerPoint template designed for analysts who want to add descriptions/insights to each chart. Speed up the process with AI-generated text suggestions:

– Dedicated space for commentary and interpretation
– Pre-filled draft texts using AI analysis based on your data and chart structure
– Analysts can edit, expand or rewrite AI suggestions freely

To produce this report template based on your data set – start using our platform!

line bg

The report structure

In this report template you have dedicated space for commentary and interpretation in each slide.

Each text area pre-filled with AI-generated analytics.

AI-about-summary
Intro
icon
About the survey
Page template with AI generated text (based on the survey questions).
icon
Summary
AI generated summary of the most important findings.
AIbackgroundvariables
Segmentation variables
icon
Segments are presented first
Background variables like age and gender used in visual subgroup comparisons later in the report.
icon
Showing number of responses and %
Both actual numbers and frequencies in percentages.
AI-chart-comments
Charts per Question & Segment

This section of the report presents each survey question on its own page, then showing responses broken down by selected segment, such as age and gender.

icon
Visualization rules applied
Chart types are chosen automatically based on both the question format and the number of subgroups being compared.
icon
Commentary section per page…
Each report page contains a designated area for descriptive text, commentary, and key insights.
icon
…AI drafts to speed it up
Every page have AI generated insights based on the chart data. Analysts can edit, expand or rewrite AI suggestions freely.
AI-verbatim-summary
VERBATIM / OPEN-ENDS

Open-end responses (Verbatim) are also included in the PowerPoint report. We have two different ways of presenting the comments depending on the amount of data.

icon
Summarized by AI…
If there are a lot of open end responses to a questions we use Open AI to summarize the data.
icon
… or presented as is
If the verbatim will fit onto a maximum of two PowerPoint pages, they are presented as is (comment by comment)

AUTOMATE YOUR POWERPOINT REPORTS!

Getting started

1. File

Upload your data

Contact us using the form below to receive your login where you can securely

  • Upload your SPSS data file (.sav)

slide image 1
2. Preview your report

Web meeting


We produce a report from your data set and present it to you in a web meeting. No costs apply.

Want to download the report?

Get a license to the Survey Automator platform!

slide image 1
3. License

Platform pricing

Pricing for “reporting-only” platform starts from:

Pricing

250 € / month

  • 20,000 data rows/ year
  • Unlimited number of projects
  • 1 user

slide image 1
4. Download

Download your reports


You get access to the platform and can create new reports whenever you like.
– Change/shorten question texts.
– Upload new data sets.
– Select new breakdown variables.
– Update your reports

slide image 1

Preview before you buy

Order report preview #AIcomments

Add your contact details below to get a free of charge (limited offer) report preview from your data set.

  • By “Submitting”, I agree that my information is handled in accordance with the privacy policy.

Want to know more before deciding?

FAQ